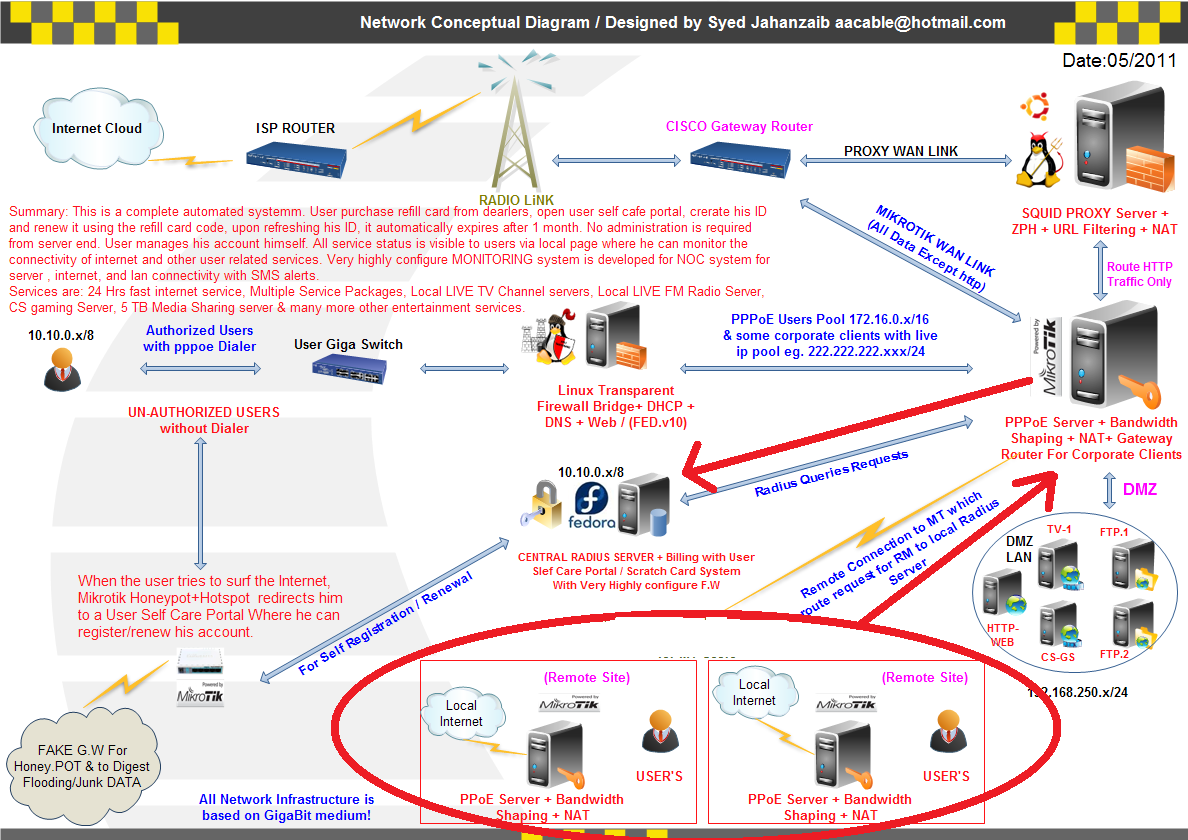
Mikrotik Related
Mikrotik Central VPN Server For Remote Branches Connectivity
Consider following scenario:
An ISP have multiple locations all over the country. Main Mikrotik router at NOC have fixed public IP. Radius Billing system is connected with LAN. All remote locations have Mikrotik Router boards as NAS and have dynamic public IP. All locations have there own internet connectivity with various ISP’s but we want to use our main RADIUS server as a centralized billing solution for all the REMOTE locations. So this is a short guide on howto create central Radius Server and connected all remote branches/nases with it.
To be continued . . . will write soon about it , while writing guide,an issue in the network popup . . 00-(
Head Office Mikrotik Config
LAN subnet = 10.0.0.1/8WAN subnet = 1.1.1.1/29
Radius = 10.0.0.2/8
First add IP pool for VPN users, like same as LAN series but with specific series.
/ip pool
add name=PPP-Pool ranges=172.16.0.1-172.16.1.255
Now add VPN Profile
/ppp profile
set 0 change-tcp-mss=yes name=default only-one=default use-compression=default use-encryption=default use-mpls=default use-vj-compression=default
add change-tcp-mss=default dns-server=101.11.11.246 local-address=101.11.11.246 name=vpn-profile only-one=default remote-address=PPP-Pool \
use-compression=default use-encryption=default use-mpls=default use-vj-compression=default
set 2 change-tcp-mss=yes name=default-encryption only-one=default use-compression=default use-encryption=yes use-mpls=default use-vj-compression=default
Now enable VPN server
/interface pptp-server server
set authentication=mschap1,mschap2 default-profile=default-encryption enabled=yes keepalive-timeout=30 max-mru=1460 max-mtu=1460 mrru=disabled
Now add user so that we will be testing from remote location NAS.
/ppp secret
add caller-id=”" disabled=no limit-bytes-in=0 limit-bytes-out=0 name=aa password=aa profile=vpn-profile routes=”" service=any
Remote Branch Mikrotik Config
LAN subnet = 192.168.100.1/8
WAN subnet = DYNAMIC Public IP x.x.x.x
Now we want to connect remote NAS with head office VPN server so that it can use central radius server as a centralized billing system.
[Mikrotik Hotspot] Possible workaround for Dynamic Queue always remain above static queue
Someone asked me about hotspot related issue . The scenario was that HOTSPOT was configured with SQUID proxy server. He also had User Manager so queuing is dynamically managed by user manager in hotspot. He had simple queue to provide cache hit marked packets unlimited speed to users. The issue was that when any hotspot user user login and Hotspot/Radius creates Dynamic Queues, and it override simple queue by moving itself above the static queue, so the cache-hit queue remain useless to provide unlimited speed to cache packets dueto its lower position.
As showed in the image below . . .
Before HOTSPOT user login,

↓
After HOTSPOT user logged in,

The workaround for this issue was to create a script that moves this static queue name “cache-hit” to 0 (top number) whenever any user login. The scripts can be added in HOTSPOT > USERS PROFILES > SCRIPTS.
This way whenever any hotspot user login, this script will run, and it will move the cache-hit to 0 number (Top)
Ok first rename your cache hit queue to “cache-hit“
Now add a script that will do actually move the cache-hit queue to top.
1
2
3
4
| /system scriptadd name=movestatic0 policy=\ftp,reboot,read,write,policy,test,winbox,password,sniff,sensitive,api \source="/queue simple move [find name=\"cache-hit\"] 0" |
Now we have to add this script in the HOTSPOT user profiles (in this example I have only one default profile, if you ahve multiple user profiles, you have to add this in all profiles either via CLI, or preferably via GUI )
1
2
3
4
| /ip hotspot user profileset [ find default=yes ] idle-timeout=none keepalive-timeout=2m name=default \on-login="/system script run movestatic0" shared-users=1 \status-autorefresh=1m transparent-proxy=no |
Now whenever any hotspot user will login , the hotspot profile will execute the script “movestatic0″ that we created earlier, and it will move the cache-hit queue to TOP.
Now the results will be as showed in the images below . . .

↓
↓
Regard’s
Syed Jahanzaib
November 23, 2013
FUN with Mikrotik BRIDGE Series#1. Filter PPPoE Requests

↓
If you are running a network or ISP/WISP, and using Mikrotik as a PPPoE
server, then you may have ran into this problem that many users have
configured wifi router at there home to share internet between
mobile/laptop and other devices, its common now a days. Usually PPPoE
dialer is configured in user WiFi ROUTER. But the problem begins that
if the user account gets expired BUT the router will keep retrying PPPoE
dialer again n again 24 hours a day , and imagine if you have lots of
routers doing this sort of flooding/bombing, you will see only PPPoE
failed authentication messages in Mikrotik logs and you wont be able to
see any other valid info due-to continuous logging of failed auth
messages. You can ignore it if the number is low, but some times it
becomes annoying to see such messages, and also if you are very short in
space with lower model of RB, then it will gonna become issue for you.
Some times its not just possible to visit at user end to tell him that
turn off his router / remove his cable from the switch , OR if you are
running layer2 un managed switches, OR you simply don’t want to visit
that user. After little searching (did not made extensive search) I
found out that from Mikrotik Firewall , you cannot block PPPoE request
as it works on BROADCAST.So I found the following method to block PPPoE request from particular VALID expired users. ( I am using the word VALID expired users, because if the user is not doing it intentionally then its easier to block him at mikrotik level, but if any smart bugger is doing it just to annoy you, you have to hunt him down and cut the cable or block at manageable AP level, because he can change the mac address any time)
Ok the simple theory is ,
1- Create bridge interface,Ok here we go . . .
2- Enable bridge firewall,
3- Add your LAN interface in it,
4- Finally create a filter that blocks PPPoE discovery for that specific
MAC addressand that’s it
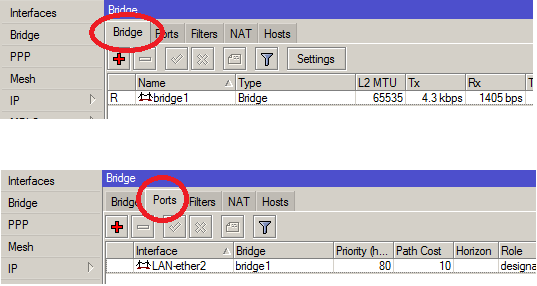
We will first add virtual BRIDGE interface
1
2
3
4
| /interface bridgeadd admin-mac=00:00:00:00:00:00 ageing-time=5m arp=enabled auto-mac=yes disabled=no forward-delay=\15s l2mtu=65535 max-message-age=20s mtu=1500 name=bridge1 priority=0x8000 protocol-mode=none \transmit-hold-count=6 |
1
2
3
| /interface bridge portadd bridge=bridge1 disabled=no edge=auto external-fdb=auto horizon=none interface=LAN-ether2 \path-cost=10 point-to-point=auto priority=0x80 |
1
2
| /interface bridge settingsset use-ip-firewall=yes use-ip-firewall-for-pppoe=yes use-ip-firewall-for-vlan=no |
1
2
3
4
| /interface bridge filteradd action=drop chain=input comment=\"Block only PPPoE Discovery (connectivity) from user 'ZAIB' to prevent pppoe flooding" disabled=no \mac-protocol=pppoe-discovery src-mac-address=00:23:AE:A8:1F:7F/FF:FF:FF:FF:FF:FF |
IF you want to BLOCK ANY traffic coming from that or other user mac address to pass from bridge to LAN interface. (some times is a good approach
1
2
3
| ## IF you want to BLOCK ANY traffic coming from that or other user#add action=drop chain=input comment="Block ANY traffic from user 'KARACHI'" disabled=yes \# mac-protocol=ip src-mac-address=00:23:AE:A8:1F:7F/FF:FF:FF:FF:FF:FF |
As showed in the image below . . .
↓
↓
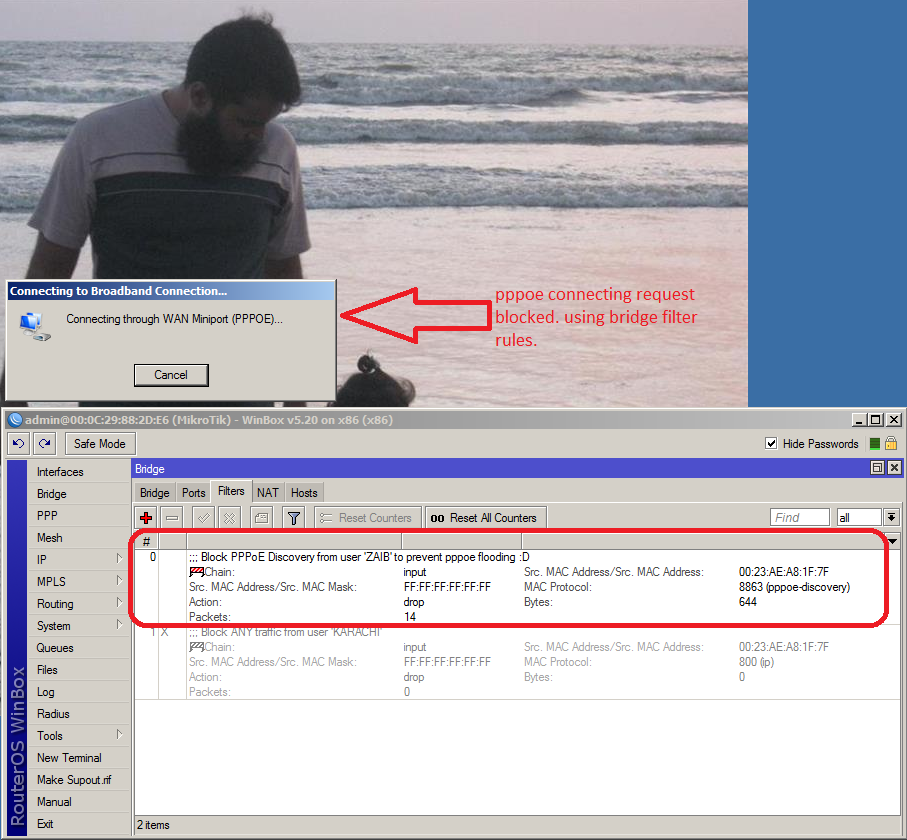 ↓
↓Note: I found this method with some R&D using WIRESHARK capturing tool but I am very confident that there are some suitable methods that maybe more simple and easier to implement with simple rules, If you have info, drop me a message so that I can update these little notes.
Another proper method is to use VLAN and manageable switches combination to block all sorts of flooding at that particular end. But usually its not affordable at smaller networks.
↓
↓
Regard’s
Syed Jahanzaib
November 13, 2013
Mikrotik with Multiple WAN IP’s and Port Forwarding / HAIRPIN NAT

Mark my words !
MIKROTIK is the Future & Cisco’s Domination is about to end.For sure CISCO still holds the majority of shares in routers world, but it will going to change very soon . . .
CISCO is best, but at higher price. Cisco have edge dueto reliable OS and Hardware.
Mikrotik is good for multi purpose in a very cheap price as compared to CISCO and offer more. So very cost effective solution.
Its all about personnel preference, choice, budget.
But Even if i have high budgeting, I will prefer Mikrotik
Jz
↓
Recently I did some testing at my office for a possible replacement of Cisco ASA 5510 Firewall/Router with Mikrotik Router-board. Following are some short reference on how I did it. I had a /29 public ip pool. Configuration was was pretty straight forward but i was confused on howto route specific LAN server (or ip) traffic with Specific WAN ip. Using src-address I managed to solve it. Following are short reference for future usage.
Scenario is as follows
We will configure all useable WAN ip addresses in mikrotik wan interface, and we will forward required ports from specific wan ip’s to specific lan servers. we will also configure firewall so that only required ports are open from WAN side for security purposes, all other traffic will be denied on WAN interface. We will also bind local servers with specific WAN ip addresses.
Mikrotik have two interfaces.
ether1 = LAN usersNow we want to forward traffic as follows. (all ip scheme used here is fictional and for example purposes only)
ether2 = WAN Link
mail server = 10.0.0.2 → 1.2.3.1 WAN IP
dude server = 10.0.0.3 → 1.2.3.2 WAN IP
cctv1 server = 10.0.0.4 → 1.2.3.3 WAN IP
cctv2 server = 10.0.0.5 → 1.2.3.4 WAN IP
IP Configuration at Mikrotik Interfaces . . .
1
2
3
4
5
6
| /ip addressadd address=10.0.0.1/8 comment=LAN disabled=no interface="LAN - ether1"add address=1.2.3.1/29 interface="WAN - ether2"add address=1.2.3.2/29 interface="WAN - ether2"add address=1.2.3.3/29 interface="WAN - ether2"add address=1.2.3.4/29 interface="WAN - ether2" |
↓
Filter Rules Section to allow only required Incoming traffic on WAN interface, and DENY all other for security purposes
Now we will first add required ports in firewall filter BEFORE DENY rule which is in last.
1
2
3
4
5
6
7
8
9
10
| /ip firewall filteradd
action=accept chain=input comment="SMTP" disabled=no
dst-address=1.2.3.1 dst-port=25 in-interface="WAN - ether2" protocol=tcpadd
action=accept chain=input comment="POP3" disabled=no
dst-address=1.2.3.1 dst-port=110 in-interface="WAN - ether2"
protocol=tcpadd
action=accept chain=input comment="Webmail" disabled=no
dst-address=1.2.3.1 dst-port=80 in-interface="WAN - ether2" protocol=tcpadd
action=accept chain=input comment="DUDE" disabled=no
dst-address=1.2.3.2 dst-port=80 in-interface="WAN - ether2" protocol=tcpadd
action=accept chain=input comment="CCTV 1" disabled=no
dst-address=1.2.3.3 dst-port=81 in-interface="WAN - ether2" protocol=tcpadd
action=accept chain=input comment="CCTV 2" disabled=no
dst-address=1.2.3.4 dst-port=82 in-interface="WAN - ether2" protocol=tcpadd action=accept chain=input comment="WINBOX 8192" disabled=no dst-port=8192 in-interface="WAN - ether2" protocol=tcpadd action=accept chain=input comment="Allow PING ICMP " disabled=no protocol=icmpadd action=drop chain=input comment="DROP ALL INCOMING TRAFFIC ON WAN INTERFACE" disabled=no in-interface="WAN - ether2" |
↓
NAT Section To Do Port Forwarding From WAN ip’s To Local Server’s and use src-nat to bind local server to route traffic via specific WAN IP
### First dst-nat section to forward port
1
2
3
4
5
6
7
8
9
10
11
12
13
14
15
16
| /ip firewall natadd
action=dst-nat chain=dstnat comment="SMTP 25 Forward to MAIL-Server"
disabled=no dst-address=1.2.3.1 dst-port=25 in-interface="WAN - ether2"
protocol=tcp to-addresses=10.0.0.2 to-ports=25add
action=dst-nat chain=dstnat comment="POP3 110 Forward to MAIL-Server"
disabled=no dst-address=1.2.3.1 dst-port=110 in-interface="WAN - ether2"
protocol=tcp to-addresses=10.0.0.2 to-ports=110add
action=dst-nat chain=dstnat comment="Web 80 Forward to MAIL-Server
Webmail" disabled=no dst-address=1.2.3.1 dst-port=80 in-interface="WAN -
ether2" protocol=tcp to-addresses=10.0.0.2 to-ports=80add
action=dst-nat chain=dstnat comment="Web 80 Forward to DUDE"
disabled=no dst-address=1.2.3.2 dst-port=80 in-interface="WAN - ether2"
protocol=tcp to-addresses=10.0.0.3 to-ports=80add
action=dst-nat chain=dstnat comment="CCTV1 - 81 Forward to cctv1"
disabled=no dst-address=1.2.3.3 dst-port=81 in-interface="WAN - ether2"
protocol=tcp to-addresses=10.0.0.4 to-ports=81add
action=dst-nat chain=dstnat comment="CCTV2 - 82 Forward to cctv2"
disabled=no dst-address=1.2.3.4 dst-port=82 in-interface="WAN - ether2"
protocol=tcp to-addresses=10.0.0.5 to-ports=82### Now route specific local servers traffic from specific WAN IP addressadd action=src-nat chain=srcnat comment="Rotue mail traffic via 1.2.3.1" disabled=no src-address=10.0.0.2 to-addresses=1.2.3.1add action=src-nat chain=srcnat comment="Rotue DUDE traffic via 1.2.3.2" disabled=no src-address=10.0.0.3 to-addresses=1.2.3.2add action=src-nat chain=srcnat comment="Rotue CCTV1 traffic via 1.2.3.3" disabled=no src-address=10.0.0.4 to-addresses=1.2.3.3add action=src-nat chain=srcnat comment="Rotue CCTV2 traffic via 1.2.3.4" disabled=no src-address=10.0.0.5 to-addresses=1.2.3.4add
action=masquerade chain=srcnat comment="Default Masquerade Rule for
LAN" disabled=no out-interface="WAN - ether2"
src-address=10.0.0.2-10.0.0.255 |
Now test it from WAN side. You can check port status from http://www.yougetsignal.com/tools/open-ports/
♣ ♣ ♣
<< HAIRPIN NAT >>
Using above method, I was ablet o successfully setup a port forwarding on a Mikrotik router that do port forwarding from mikrotik wan ip to local lan servers (Example: 1.2.3.4:3389 to 192.168.1.10:3389)BUT there is a BUT, when I tried to open Mikrotik WAN ip from local LAN user, for example
192.168.1.20 –> 1.2.3.4:3389 –> 192.168.1.10:3389it didn’t opened and the connection goes in SINK hole, means lost.
The solution was to rewrite the port forwarding rule to NOT to use in-interface=WAN-GATEWAY, but dst-address-type=local
This is called – among other terms – hair pin NAT because the traffic flow has clients enter the router through the same interface it leaves through, which when drawn looks like a hair pin.
As showed in the example below . . .
1
2
3
4
5
6
7
| # DST-NAT rule to redirect port 3389 from/ip firewall natadd
action=dst-nat chain=dstnat disabled=no dst-address=1.2.3.4
dst-address-type=local dst-port=3389 protocol=tcp
to-addresses=192.168.1.10 to-ports=3389 comment="Redirect RDP PORT TCP
3389 to local server"# Masquerade local traffic going to mikrotik WAN IP - [To access that service from LAN using mikrtoik wan ip]/ip firewall natadd
chain=srcnat src-address=192.168.1.0/24 dst-address=192.168.1.10
protocol=tcp dst-port=3389 out-interface=LAN-Interface action=masquerade
comment="Masquerade Traffic going to WAN IP of mikrotik from local LAN
users" |
Syed Jahanzaib
November 2, 2013
Mikrotik DUDE SMS Notification !

Scenario:
GSM device is connected with Mikrotik for SEND/RECEIVE purposes.
DUDE is installed in Windows base PC.
As far as my research goes, there is no direct method in Dude to send SMS using DUDE own mechanism, you must have to involve / call 3rd party tool to accomplish the sms sending task. It can be windows CLI base SMS sender program like smssender.exe/gammu for win32 , sms base HTTP gateway or whatever.
You can also connect gsm device to your windows base PC, but in my scenario, my gsm device was not supported in 64 bit version of Windows 7, that’s why I had to take a long route of sending sms via mikrotik, also my mikrotik is set to receive sms to to perform various function like reboot, wan status etc , so chill
Now the simple task is that we want to send DUDE notification via SMS using Mikrotik GSM/Mobile device, Just in case any critical device/server goes down.
We have to configure both Mirkotik server as well as DUDE too. so first Mikrotik section.
↓
MIKROTIK Section:
First make sure you have configured your gsm/mobile device properly in mikrotik and you have tested it by sending an test SMS. Read the following article for reference.http://aacable.wordpress.com/2012/11/22/howto-enable-mikrotik-to-sendreceive-sms-using-gsm-modem/
Also don’t forget to enable SSH service in Mikrotik as we will use ssh to execute sms send command from DUDE server.
[Note: Be careful , enabling SSH service can potentially open door for some unwanted guests/possible hackers, So better to allow only DUDE server IP for ssh access via filter rule]
.
DUDE Section:
First Download PLINK which will be used to SSH in to Mikrotik and execute send sms command on behalf of dude. click here to download plink and copy it to any folder like c:\temp\ , Also turn off File Run warning from Windows Firewall.http://the.earth.li/~sgtatham/putty/latest/x86/plink.exe
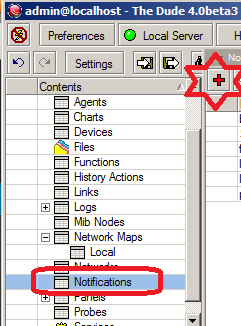
Now at DUDE Service, on the left menu, Goto Notifications and add new one by click on + sign or right click/add.
↓
As showed in the image below . . .
↓
Now use following details.
Name = SMS Notification
Type = Execute on Server
Command:
c:\temp\plink.exe -ssh -l admin -pw 123 192.168.1.11 “/tool sms send phone-number=03333021909 usb3 message=[Probe.Name]_on_[Device.Name]_is_now__[Service.Status]“
[Change the password + IP + mobile number + USB Port number from above command]
Make sure your device name and message have no BLANK SPACES in it, thats why I used underscore or dash.
It took me 3-4 hours just to figure out that spaces were not supported or create problems with brackets [( )]
hope this will help some one ☺
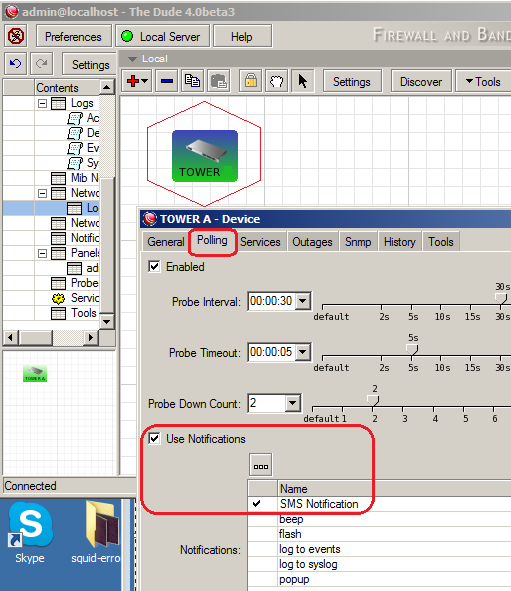
↓
As showed in the image below . . .
↓

.
From your MAP, select the device you want to monitor and receive sms alert for.
Goto POLLING , and click on USE NOTIFICATION
Now you will “SMS NOTIFICATION” , Simply Select it, and click on APPLY/OK.
As showed in image below . . .
↓
 .
.Now test it by disconnecting that target device (or for test change the IP address to some unreachable IP in target IP)
You should receive the alert on your SMS
☺
☺
☺
Regard’s
Syed Jahanzaib
October 31, 2013
Monitoring Mikrotik with Linux base MRTG [References]

I have another article that explains well about monitoring most of the mikrotik parts via nix base MRTG but it have lots of junk data too , curse upon WordPress who always messes with the coding and most of the time my hard work goes to TRASH
I will post updates
↓
# Enabling SNMP on Mikrotik
First Enable SNMP service (with public as community string or whatever you like on your mikrotik. Make sure no firewall rule is blocking SNMP traffic from/to the monitoring server.Open Terminal in mikrotik and paste the following command. Or you can configure it via going to IP > SNMP
1
2
3
4
5
6
7
| /snmp communityset
[ find default=yes ] addresses=0.0.0.0/0 authentication-password=""
authentication-protocol=MD5 encryption-password=""
encryption-protocol=DES name=public read-access=yes \security=none write-access=no/snmpset
contact=Syed-Jahanzaib enabled=yes engine-id=""
location=aacable-wordpress-com trap-community=public trap-generators=""
trap-target="" trap-version=1[admin@MikroTik-2] /snmp> |
↓
1. Monitoring Mikrotik Simple Queue with Linux base MRTG (for monitoring performance and track purposes)
↓To monitor simple QUEUE via Linux base MRTG, you can use following config as an example
First you have to check your simple queue OID (numeric value which is used by MRTG to poll specific data from the remote server) in mikrotik. for example you have a queue to allow 100M for proxy cached marked packets.

Open Terminal and print OID for Simple Queue number 0 (your can be changed, but in general Queue for proxy hit packets should be on ** TOP ** )
1
2
3
4
5
6
7
| [admin@MikroTik] /queue simple printFlags: X - disabled, I - invalid, D - dynamic0 ;;; Simple Queue for squid Proxy CACHE HIT Packet Allow Unlimited Bandwidthname=SQ-for-cache-hit
interface=all parent=none packet-marks=Cache direction=both priority=8
queue=default-small/default-small limit-at=0/0 max-limit=100M/100M
burst-limit=0/0burst-threshold=0/0 burst-time=0s/0s total-queue=default-small |
1
2
3
4
5
6
7
| [admin@MikroTik] /queue simple print oidFlags: X - disabled, I - invalid, D - dynamic0 ;;; Simple Queue for squid Proxy CACHE HIT Packet Allow Unlimited Bandwidthname=.1.3.6.1.4.1.14988.1.1.2.1.1.2.12534
bytes-in=.1.3.6.1.4.1.14988.1.1.2.1.1.8.12534
bytes-out=.1.3.6.1.4.1.14988.1.1.2.1.1.8.12534
packets-in=.1.3.6.1.4.1.14988.1.1.2.1.1.10.12534packets-out=.1.3.6.1.4.1.14988.1.1.2.1.1.11.12534
queues-in=.1.3.6.1.4.1.14988.1.1.2.1.1.12.12534
queues-out=.1.3.6.1.4.1.14988.1.1.2.1.1.13.12534 |
As showed in the image below . . .

↓
Now we have to take bytes-in and bytes-out value for graphing purposes. which is in our case are
.1.3.6.1.4.1.14988.1.1.2.1.1.8.12534Now you can simply use the below CFG file to create Graphs for the mikrotik simple queue.
.1.3.6.1.4.1.14988.1.1.2.1.1.9.12534
1
2
3
4
5
6
7
8
9
10
11
| Target[mikrotik-simple-queue-in-out]:
.1.3.6.1.4.1.14988.1.1.2.1.1.8.12534&.1.3.6.1.4.1.14988.1.1.2.1.1.9.12534:public@10.0.0.1MaxBytes[mikrotik-simple-queue-in-out]: 100000000#Options[mikrotik-simple-queue-in-out]: bitsTitle[mikrotik-simple-queue-in-out]: Mikrotik QUEUE for Cache HITPageTop[mikrotik-simple-queue-in-out]: <H1>Mikrotik QUEUE for Cache HIT</H1><TABLE><TR><TD>Port:</TD><TD>Connected on WAN router</TD></TR><TR><TD>Maintainer:</TD><TD>Syed Jahanzaib</TD></TR><TR><TD>Interface:</TD><TD>eth0</TD></TR><TR><TD>Max Speed:</TD><TD>10.mbps poor man</TD></TR></TABLE |
↓
SAMPLE GRAPH FOR THE SIMPLE QUEUE MONITORING VIA MRTG
↓ .
..
2. Monitoring CPU Usage
1
2
3
4
5
6
7
8
9
10
| ### MIKROTIK 10.0.0.1 CPU load ###Target[10.0.0.1_cpu]: 1.3.6.1.2.1.25.3.3.1.2.1&1.3.6.1.2.1.25.3.3.1.2.1:public@10.0.0.1AbsMax[10.0.0.1_cpu]: 100MaxBytes[10.0.0.1_cpu]: 100Title[10.0.0.1_cpu]: MIKROTIK CPU loadPageTop[10.0.0.1_cpu]: <H1>MIKROTIK CPU load</H1>Options[10.0.0.1_cpu]: gauge,growright,nopercent, nooYLegend[10.0.0.1_cpu]: CPU loadShortLegend[10.0.0.1_cpu]: %LegendI[10.0.0.1_cpu]: CPU load (percentage) |
As showed in the image below . . .
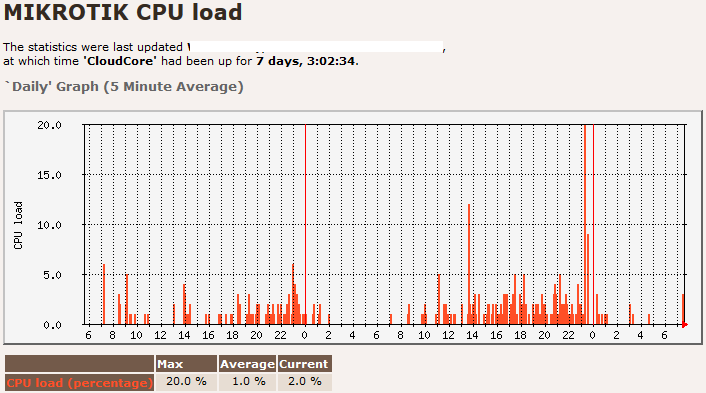
↓
↓
3. Monitoring Active PPP Users
1
2
3
4
5
6
7
8
9
10
11
12
| # Mikrotik PPP ACTIVE UsersTarget[mtpppusers]: 1.3.6.1.4.1.9.9.150.1.1.1.0&1.3.6.1.4.1.9.9.150.1.1.1.0:public@10.0.0.1Title[mtpppusers]: Active PPP Users on MTPageTop[mtpppusers]: <H1>Active PPP Users on MT</H1>MaxBytes[mtpppusers]: 300Colours[mtpppusers]: B#8888ff,B#8888ff,B#5398ff,B#5398ffOptions[mtpppusers]: gauge,nopercent,noo,integer,growrightLegendI[mtpppusers]: Active PPP Users on MTLegendO[mtpppusers]:YLegend[mtpppusers]: Active PPP Users on MTLegend1[mtpppusers]: Active PPP Users on MTLegend2[mtpppusers]: |
As showed in the image below . . .
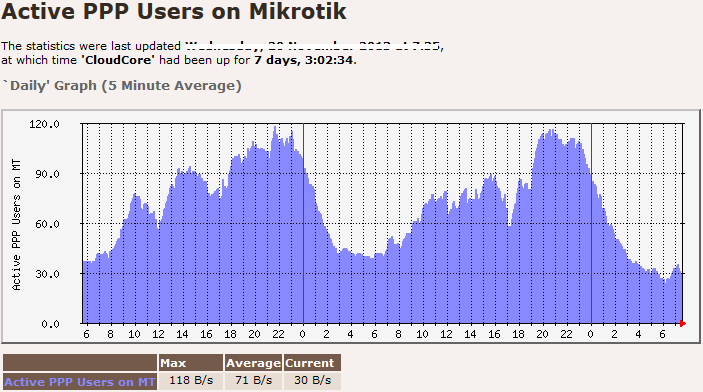
↓
4. Monitoring RB CPU Temperature
1
2
3
4
5
6
7
8
9
10
11
12
13
14
| ### MONITORING Mikrotik CPU TEMP ###Target[mt.cpu.temp]: 1.3.6.1.4.1.14988.1.1.3.11.0&.1.3.6.1.4.1.14988.1.1.3.11.0:public@10.0.0.1Options[mt.cpu.temp]: gauge, growright, nopercent, noinfoMaxBytes[mt.cpu.temp]: 100Colours[mt.cpu.temp]: RED#ff4f27,Y#fffb15,RED#ff4f27,RED#fffb15#Unscaled[mt.cpu.temp]: dwmyYLegend[mt.cpu.temp]: CPU TempratureTitle[mt.cpu.temp]: Mikrotik RB CPU TempraturePageTop[mt.cpu.temp]: <H1>Mikrotik RB CPU Temprature</H1>ShortLegend[mt.cpu.temp]: cLegendI[mt.cpu.temp]:LegendO[mt.cpu.temp]: CPU TempLegend1[mt.cpu.temp]: CPU TempratureLegend2[mt.cpu.temp]: CPU Temprature |
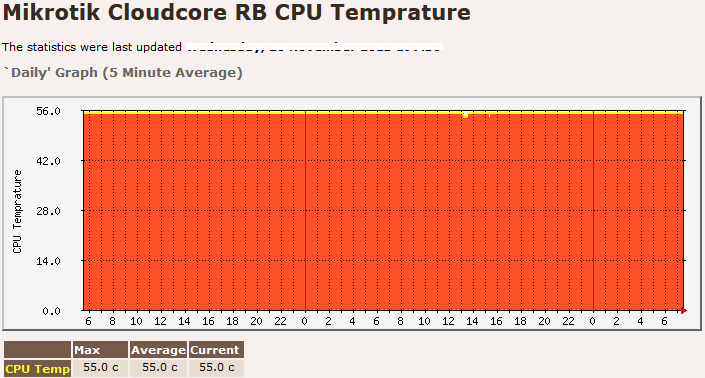
↓
5. Monitoring Routerboard Temperature
1
2
3
4
5
6
7
8
9
10
11
12
13
14
| ### MONITORING Mikrotik RB TEMP ###Target[mt.rb.temp]: 1.3.6.1.4.1.14988.1.1.3.10.0&.1.3.6.1.4.1.14988.1.1.3.10.0:public@10.0.0.1Options[mt.rb.temp]: gauge, growright, nopercent, noinfoMaxBytes[mt.rb.temp]: 100Colours[mt.rb.temp]: RED#ff4f27,Y#fffb15,RED#ff4f27,RED#fffb15#Unscaled[mt.rb.temp]: dwmyYLegend[mt.rb.temp]: RBTempratureTitle[mt.rb.temp]: Mikrotik Router Board TempraturePageTop[mt.rb.temp]: <H1>Mikrotik Router Board Temprature</H1>ShortLegend[mt.rb.temp]: cLegendI[mt.rb.temp]:LegendO[mt.rb.temp]: RB TempLegend1[mt.rb.temp]: RB TempratureLegend2[mt.rb.temp]: RB Temprature |

↓
6. Monitoring Routerboard Voltage
1
2
3
4
5
6
7
8
9
10
11
12
13
14
15
| ### MONITORING Mikrotik VOLTAGE Monitor ###Target[mt-voltage]: .1.3.6.1.4.1.14988.1.1.3.8.0&.1.3.6.1.4.1.14988.1.1.3.8.0:public@10.0.0.1 / 10Options[mt-voltage]: gauge, growright, nopercent, noinfoMaxBytes[mt-voltage]: 1000Colours[mt-voltage]: RED#ff4f27,Y#fffb15,RED#ff4f27,RED#fffb15#Unscaled[mt-voltage]: dwmyYLegend[mt-voltage]: Voltaeg MonitorTitle[mt-voltage]: Mikrotik Cloudcore RB VOLTAGE MonitorPageTop[mt-voltage]: <H1>Mikrotik Cloudcore RB VOLTAGE Monitor</H1>ShortLegend[mt-voltage]: cLegendI[mt-voltage]:LegendO[mt-voltage]: VoltageLegend1[mt-voltage]: VoltageLegend2[mt-voltage]: Voltage |

.
.
Regard’s
Syed Jahanzaib
September 12, 2013
RouterOS by Example – By – Stephen Discher
![RouterOS by Example - Stephen Discher[jz]]](http://aacable.files.wordpress.com/2013/09/routeros-by-example-stephen-discherjz.png)
A comprehensive and practical guide to MikroTik RouterOS. Useful literature with examples and other reference materials. Recommended for beginners and administrators ☺
The cost is $49.95 (+ tax if shipped to a Texas address) plus shipping anywhere in the world (international shipping by US Postal Service Priority Mail for only $16.95!).
.
Download Link:
.http://learnmikrotik.com/index.php/get-the-book.html
.
Regard’s
Syed Jahanzaib
August 20, 2013
Monitor Switch Ports Up/Down Status via Mikrotik Dude – Short Notes


.
In my network, I have few Cisco switches at various departments connected via FIBER optics. Recently we were having issue of network connectivity in between various switches and devices. I already have a very good setup of Mikrotik base DUDE monitoring system, but it shows only the SWITCH availability status on the screen, I wanted to have a good visual for switch ports too.
I found few ways to accomplish this task using DUDE functions, scripts, etc, but found following method is very simple to start with . It also sends me email when any port goes Down or not in use.
Make sure your switch support SNMP , and SNMP agent is enabled at your SWITCH as well as at your DUDE to match the same. For simplicity you can use PUBLIC as a default community string in the switch. Also In this example I have used CISCO 3750 (in dual stack mode) and add only few ports just for example.
First add your switch in the map so that it can appear in the map as look like below.
As showed in the image below . . .
 .
..
.
Adding PROBE for port monitoring
Now to add PORTS monitoring, Open Dude,Goto PROBES and click on + sign to add new probe.
Use the following data.
Name = PORT 9
Type = SNMP
SNMP Profile = Your SNMP Profile
Oid = iso.org.dod.internet.mgmt.mib-2.interfaces.ifTable.ifEntry.ifOperStatus.10109
Oid Type = integer
Comapre method = ==equal
Integer Value = 1
As showed in the image below . . .

Note: Change the OID number to match the port number on your switch , for example I am monitoring port number9 which value is 10109 . You can use SNMPWALK via DUDE to check the OID’s for different ports of your switch.
Now click OK to save
.
.
Adding Switch PORT separately using IP and PROBE
Its time to add PORTs in your map so they can appear separately as showed in the title imageGo back to your MAP,
Right click and ADD new device,
Type your switch IP address, and click on Next,
Now DO NOT click on Discover , simply click on + sign
In PROBE, Select the PORT 9 probe you created earlier
and click on Apply/OK
As showed in the image below . . .

Click on Finish.
.
.
Now you will see something like below . . .

As you can see the port number 9 is down , so the status is shown correctly.
.
.
Now you can repeat the same procedure to add as much ports you like to monitor.
Something like below image . . .

.
.
.
Adding LINKS to monitor port usage
You can also add LINKS to show the port usageAs showed in the example below . . .


.
.
.
After adding ports / snmp links, and other enhancements , you can see something like below image . .
.
 .
.
.
.
I will add more methods to monitor the ports. For more info , please read more at following links
.
.
.
Regard’s
Syed Jahanzaib
Syed Jahanzaib
May 16, 2013
Mikrotik Webproxy with PCC
I received few requests from friends on how to configure mikrotik web proxy with PCC on same box to save hardware resources and ease of management. Although I never recommend to use Mikrotik web proxy as it is designed for SOHO usage, and suitable for small networks. It have basic capability of simple objects and it have only few options to tune.
- Usually when you enable web proxy on pcc, it wont work. To make it work you have to mark web proxy connection in output chain, and exlude port 80 traffic from pre-routing PCC rules. Example is as below. (I assume you have dual wan pcc already configured and in running state)
.
Add Rules in Output Chain & exclue port 80 traffic from PCC prerouting chain
Add following rules (Output chain)/ip firewall mangle
add action=mark-connection chain=output comment=”Marking Web Proxy Connection for WAN-1″ disabled=no dst-port=80 new-connection-mark=WAN1_conn passthrough=yes per-connection-classifier=\
both-addresses-and-ports:2/0 protocol=tcp
add action=mark-connection chain=output comment=”Marking Web Proxy Connection for WAN-2″ disabled=no dst-port=80 new-connection-mark=WAN2_conn passthrough=yes per-connection-classifier=\
both-addresses-and-ports:2/1 protocol=tcp
.
Now exclude port 80 from the PCC rules in pre-routing chain.
add action=mark-connection chain=prerouting comment=”Excluding Port 80 from PCC – WAN1″ disabled=no dst-address-type=!local dst-port=!80 in-interface=LAN new-connection-mark=WAN1_conn passthrough=yes \
per-connection-classifier=both-addresses-and-ports:2/0 protocol=tcp
add action=mark-connection chain=prerouting comment=”Excluding Port 80 from PCC – WAN2″ disabled=no dst-address-type=!local dst-port=!80 in-interface=LAN new-connection-mark=WAN2_conn passthrough=yes \
per-connection-classifier=both-addresses-and-ports:2/1 protocol=tcp
As showed in the image below . . .

.
.
.
Enable Mikrotik Web Proxy
Now Enable Web proxy./ip proxy
set
 always-from-cache=no cache-administrator=webmaster cache-hit-dscp=4
cache-on-disk=yes enabled=yes max-cache-size=unlimited
max-client-connections=600 max-fresh-time=3d \
max-server-connections=600 parent-proxy=0.0.0.0 parent-proxy-port=0 port=8080 serialize-connections=no src-address=0.0.0.0
As showed in the image below . . .

.
.
Redirect port 80 traffic to web proxy (Transparent Proxy)
Now redirect users port 80 traffic to web proxy by creating a NAT rule so all users browsing (port 80) request should automatically be redirected to mikrotik web proxy, (aka Transparent Proxy) (Move this rule at end in NAT section)/ip firewall nat
add action=redirect chain=dstnat comment=”Redirect port 80 request to Web Proxy” disabled=no dst-port=80 protocol=tcp to-ports=8080
As showed in the image below . . .

.
.
.
Now try to browse from client side, or download using IDM etc, and see the both WAN usage and web proxy status.
WAN USAGE STATUS >

.
.
WEB PROXY USAGE STATUS >

.
.
.
Mikrotik EXPORT with complete script for Dual WAN and Proxy.
1
2
3
4
5
6
7
8
9
10
11
12
13
14
15
16
17
18
19
20
21
22
23
24
25
26
27
28
29
30
31
32
33
34
35
36
37
38
39
40
41
42
43
44
45
46
47
48
49
50
51
52
| [admin@MikroTik-2] > /ip ad ex# may/16/2013 09:09:34 by RouterOS 5.20# software id = zaib-home/ip addressadd address=10.0.0.1/8 disabled=no interface=WAN1 network=10.0.0.0add address=192.168.0.1/24 disabled=no interface=WAN2 network=192.168.0.0add address=192.168.5.1/24 disabled=no interface=LAN network=192.168.5.0/ip dnsset allow-remote-requests=yes cache-max-ttl=1w cache-size=5000KiB max-udp-packet-size=512 servers=8.8.8.8/ip proxyset
always-from-cache=no cache-administrator=webmaster cache-hit-dscp=4
cache-on-disk=yes enabled=yes max-cache-size=unlimited
max-client-connections=600 max-fresh-time=3d \max-server-connections=600 parent-proxy=0.0.0.0 parent-proxy-port=0 port=8080 serialize-connections=no src-address=0.0.0.0/ip firewall mangleadd action=mark-connection chain=input disabled=no in-interface=WAN1 new-connection-mark=WAN1_conn passthrough=yesadd action=mark-connection chain=input disabled=no in-interface=WAN2 new-connection-mark=WAN2_conn passthrough=yesadd
action=mark-connection chain=output comment="Marking Web Proxy
Connection for WAN-1" disabled=no dst-port=80
new-connection-mark=WAN1_conn passthrough=yes
per-connection-classifier=\both-addresses-and-ports:2/0 protocol=tcpadd
action=mark-connection chain=output comment="Marking Web Proxy
Connection for WAN-2" disabled=no dst-port=80
new-connection-mark=WAN2_conn passthrough=yes
per-connection-classifier=\both-addresses-and-ports:2/1 protocol=tcpadd
action=mark-connection chain=prerouting comment="Excluding Port 80 from
PCC - WAN1" disabled=no dst-address-type=!local dst-port=!80
in-interface=LAN new-connection-mark=WAN1_conn passthrough=yes \per-connection-classifier=both-addresses-and-ports:2/0 protocol=tcpadd
action=mark-connection chain=prerouting comment="Excluding Port 80 from
PCC - WAN2" disabled=no dst-address-type=!local dst-port=!80
in-interface=LAN new-connection-mark=WAN2_conn passthrough=yes \per-connection-classifier=both-addresses-and-ports:2/1 protocol=tcpadd
action=mark-routing chain=prerouting connection-mark=WAN1_conn
disabled=no in-interface=LAN new-routing-mark=to_WAN1 passthrough=yesadd
action=mark-routing chain=prerouting connection-mark=WAN2_conn
disabled=no in-interface=LAN new-routing-mark=to_WAN2 passthrough=yesadd action=mark-routing chain=output connection-mark=WAN1_conn disabled=no new-routing-mark=to_WAN1 passthrough=yesadd action=mark-routing chain=output connection-mark=WAN2_conn disabled=no new-routing-mark=to_WAN2 passthrough=yesadd action=accept chain=prerouting disabled=no dst-address=10.0.0.0/8 in-interface=LANadd action=accept chain=prerouting disabled=no dst-address=192.168.0.0/24 in-interface=LAN/ip firewall natadd action=masquerade chain=srcnat comment="Masquerade WAN1 Traffic" disabled=no out-interface=WAN1add action=masquerade chain=srcnat comment="Masquerade WAN2 Traffic" disabled=no out-interface=WAN2add
action=redirect chain=dstnat comment="Redirect port 80 request to
Mikrotik Web Proxy" disabled=no dst-port=80 protocol=tcp to-ports=8080/ip routeadd
check-gateway=ping disabled=no distance=2 dst-address=0.0.0.0/0
gateway=10.0.0.1 routing-mark=to_WAN1 scope=30 target-scope=10add
check-gateway=ping disabled=no distance=1 dst-address=0.0.0.0/0
gateway=192.168.0.1 routing-mark=to_WAN2 scope=30 target-scope=10add check-gateway=ping disabled=no distance=1 dst-address=0.0.0.0/0 gateway=192.168.0.1 scope=30 target-scope=10add check-gateway=ping disabled=no distance=2 dst-address=0.0.0.0/0 gateway=10.0.0.1 scope=30 target-scope=10[admin@MikroTik-2] > |
SYED JAHANZAIB
April 12, 2013
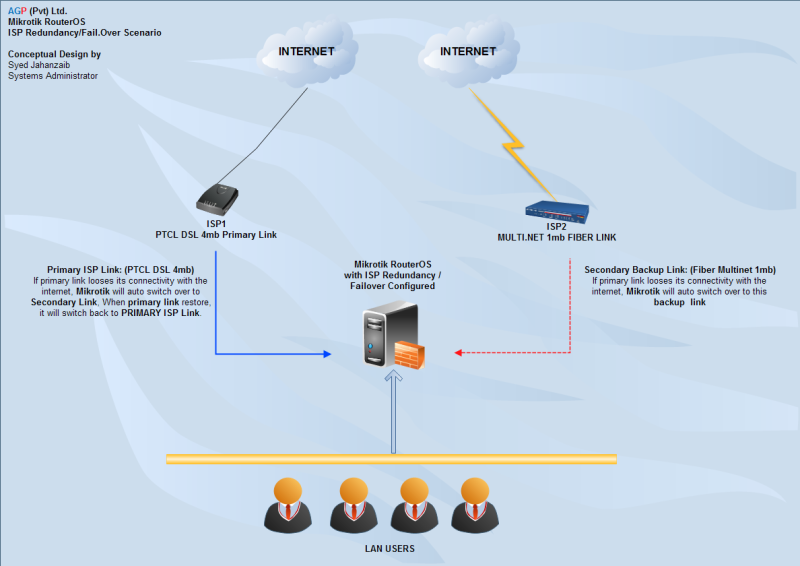
Mikrotik Multi WAN Fail Over Scenarios
I received many requests from various friends/personnel’s to write something easy about howto create fail over for PCC/Dual Wan . In this guide, I will post some WAN link fail over scenarios. For example If you have two DSL wan links, and one of link goes down , What will happen? If your DSL modem is down – then check-gateway=ping can save your packets from being sent to that link , But what if your modem is up, and telephone line is down? Or one of your ISP has a problem from there end ????
There are several method that you can use to sort this problem, either by using NetWatch tool to monitor WAN link , or you can use use scripts to periodically ping remote hosts. And then disable/enable routes.
Following is a very simple method you can use for fail over.
SCENARIO #1
FAIL OVER for Dual WAN links without Load Balancing & without Scripting
We have two WAN links and we want to use second WAN for fail over ONLY, No load balancing is required.
To achieve fail-over follow the below
Example:
LAN = 192.168.0.1
WAN1 GW = 192.168.1.1
WAN2 GW = 192.168.2.1
External Host ip that we want to monitor for the WAN status. (You can use your ISP’s DNS / Web server ip also or any one which is more reliable and preferably closer to you)
Google DNS = 8.8.8.8
TW DNS (PK) = 221.132.112.8
Following is complete script.
1# Make sure you change the interface names and IP addresses according to your network,
2# In DNS section, Use your ISP’s DNS ip addresses
3# You can use different host ip addresses for monitoring, preferably your primary ISP’s reliable servers like DNS or other. You can use other web sites ips too.
1
2
3
4
5
6
7
8
9
10
11
12
13
14
15
16
17
18
19
20
21
22
23
24
25
| # apr/12/2013 10:41:20 by RouterOS 5.20# Syed Jahanzaib / aacable@hotmail.com# Web= http://aacable.wordpress.com/ip addressadd address=192.168.0.1/24 disabled=no interface=LAN network=192.168.0.0add address=192.168.1.2/24 disabled=no interface=WAN1 network=192.168.1.0add address=192.168.2.2/24 disabled=no interface=WAN2 network=192.168.2.0/ip dnsset allow-remote-requests=yes cache-max-ttl=1w cache-size=5000KiB \max-udp-packet-size=512 servers=208.67.222.222,202.141.224.34# Or use your ISP's DNS/ip firewall natadd action=masquerade chain=srcnat disabled=no out-interface=WAN1add action=masquerade chain=srcnat disabled=no out-interface=WAN2#### Following is ROUTE section where we will be using check-gateway function to monitor external hosts from each wan/ip routeadd dst-address=8.8.8.8 gateway=192.168.1.1 scope=10add dst-address=221.132.112.8 gateway=192.168.2.1 scope=10add distance=1 gateway=8.8.8.8 check-gateway=pingadd distance=2 gateway=221.132.112.8 check-gateway=ping |
SCENARIO #2
FAIL OVER for Dual WAN links without Load Balancing using SCRIPT
If you have 2 WAN Links , and you want to use Primary Link for Main internet usage, and in case Primary Link [WAN1] Looses its connectivity with the INTERNET (For example problem with the link between your modem and ISP or Problem between ISP link and the internet), then Secondary Link take its place, and when Primary link [WAN1] restores, it will become active again. You can use the following scripts.
You have to create two scripts for this purpose.
SCRIPT-1 will check Internet connectivity by ping to Google DNS 8.8.8.8 (You can change this value) using Default Primary Link[WAN1], if it fails to receive reply, it will change this route distance value to 3.
SCRIPT-2 will check internet connectivity using Primary Link, if it able to get reply from Google DNS IP 8.8.8.8, it will Primary Link Routedistance value to 1 again, thus primary link will become Active again.
Route Distance values should be
[WAN1] PRIMARY link with Route DISTANCE value 1
&
[WAN2] SECONDARY link with Route DISTANCE value 2,
Make sure that you must do the following
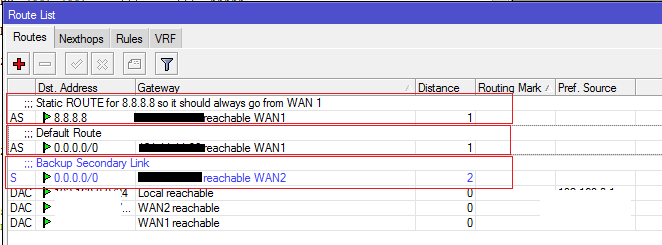
1- Add following comment in the Default Primary Link [WAN1] route
Default Route(If you don’t add this comment , Script wont be able to locate your default route)
2- Add static route for 8.8.8.8 [google dns] to make sure that monitoring to google dns always goes via primary link). This is very important
Ok It’s time to add Scripts
.
.
SCRIPT 1: (For WAN1 Down status checking)
It will check Internet Connectivity (with google DNS 8.8.8.8 , you can change it) Using Default Route (Primary Link[WAN1]), if it fails to get replies from it, it will change the distance value of primary link to 3 , so Secondary Link [WAN2] will automatically be promoted and it will act as the Primary Link for the connectivity.Note: Following scripts have been taken from following link. I only modify it for my local need.
http://wiki.mikrotik.com/wiki/Improved_Netwatch_II
1
2
3
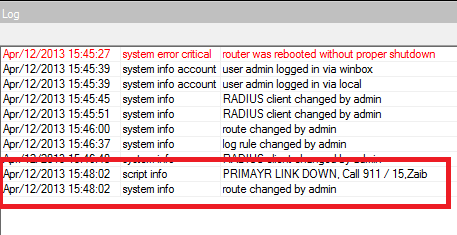
| :local i 0; {:do {:set i ($i + 1)} while (($i < 5) && ([/ping 8.8.8.8 interval=3 count=1]=0))};:if
($i=5 && [/ip route get [find comment="Default Route"]
distance]=1) do={:log info "PRIMAYR LINK DOWN, Call 911 / 15,Zaib";/ip route set [find comment="Default Route"] distance=3} |
.
SCRIPT 2: (For WAN1 UP status checking)
It will again check Internet Connectivity (with Google DNS 8.8.8.8 ) using Default Route (Primary Link[WAN1]) as we have also set fixed route for 8.8.8.8 to always go throught primary link , If it get ping replies from teh google dns using the Primary Link [WAN1], it will change the Primary Link [WAN1] Route Distance back to 1 , so it will become Primary Link again.
1
2
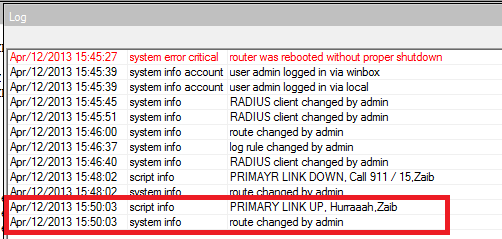
3
| :local i 0; {:do {:set i ($i + 1)} while (($i < 5) && ([/ping 8.8.8.8 interval=3 count=1]=1))};:if ($i=5 && [/ip route get [find comment="Default Route"] distance]=3) do={:log info "PRIMARY LINK UP, Hurraaah,Zaib";/ip route set [find comment="Default Route"] distance=1} |
Default Route
(If you don’t add this comment , Script wont be able to locate your default route)
 Now You can now schedule them to run SCRIPTs every 1 minute or whatever is ok for you.
You will see following entries in LOG when WAN link goes DOWN and UP. You can also configure actions to email or SMS you if any link goes down for tack purposes, or if you want to be informed about the WAN status.
As showed in the image below . .
.
.
.
.
SCENARIO #3
DUAL WAN LOAD BALANCING USING PCC WITH FAIL OVER without scripting (Very useful )
The following script does the two wan load balancing using PCC
method, also if any of WAN link will fail , it will automatically fail
over to secondary link, and when the particular failed link becomes
available load will be start distributing among both links (remember it
will not shift back previously made connections like downloads via idm
etc. new packets will be distributed) .The only negative is that we are
using single wan host to monitor, if that particular host (e.g 8.8.8.8)
ping goes down and the rest is fine , wan1 link will still shift to
secondary link. To avoid it use multiple hosts to monitor wan
connectivity.1# Make sure you change the interface names and IP addresses according to your network,
2# In DNS section, Use your ISP’s DNS ip addresses
3# You can use different host ip addresses for monitoring, preferably your primary ISP’s reliable servers like DNS or other. You can use other web sites ips too.
1
2
3
4
5
6
7
8
9
10
11
12
13
14
15
16
17
18
19
20
21
22
23
24
25
26
27
28
29
30
31
32
33
34
35
36
37
38
39
40
41
42
43
44
45
46
47
48
49
50
51
52
| # apr/12/2013 11:13:43 by RouterOS 5.20# Syed Jahanzaib / aacable@hotmail.com# Web= http://aacable.wordpress.com/ip addressadd address=192.168.0.1/8 disabled=no interface=WAN1 network=192.168.0.0add address=192.168.1.2/24 disabled=no interface=WAN2 network=192.168.1.0add address=192.168.2.2/24 disabled=no interface=LAN network=192.168.2.0/ip dnsset allow-remote-requests=yes cache-max-ttl=1w cache-size=5000KiB max-udp-packet-size=512 servers=208.67.222.222,202.141.224.34# Use your OWN isp DNS ips , in this example I have used OPENDNS and other isp dns. Filtering is ON at opendns/ip firewall mangleadd action=accept chain=prerouting disabled=no dst-address=192.168.1.0/24 in-interface=LANadd action=accept chain=prerouting disabled=no dst-address=192.168.2.0/24 in-interface=LANadd action=mark-connection chain=input disabled=no in-interface=WAN1 new-connection-mark=WAN1_mark passthrough=yesadd action=mark-connection chain=input disabled=no in-interface=WAN2 new-connection-mark=WAN2_mark passthrough=yesadd action=mark-routing chain=output connection-mark=WAN1_mark disabled=no new-routing-mark=to_ISP1 passthrough=yesadd action=mark-routing chain=output connection-mark=WAN2_mark disabled=no new-routing-mark=to_ISP2 passthrough=yesadd
action=mark-connection chain=prerouting disabled=no
dst-address-type=!LAN in-interface=LAN new-connection-mark=WAN1_mark
passthrough=yes per-connection-classifier=both-addresses-and-ports:2/0add
action=mark-connection chain=prerouting disabled=no
dst-address-type=!LAN in-interface=LAN new-connection-mark=WAN2_mark
passthrough=yes per-connection-classifier=both-addresses-and-ports:2/1add
action=mark-routing chain=prerouting connection-mark=WAN1_mark
disabled=no in-interface=LAN new-routing-mark=to_ISP1 passthrough=yesadd
action=mark-routing chain=prerouting connection-mark=WAN2_mark
disabled=no in-interface=LAN new-routing-mark=to_ISP2 passthrough=yes# Default masquerade rule for both WAN links/ip firewall natadd action=masquerade chain=srcnat disabled=no out-interface=WAN1add action=masquerade chain=srcnat disabled=no out-interface=WAN2### ROUTE SECTION ###### Magic begins here/ip routeadd dst-address=8.8.8.8 gateway=192.168.1.1 scope=10add dst-address=221.132.112.8 gateway=192.168.2.1 scope=10## Now we create rules for Isp's routing mark:add distance=1 gateway=8.8.8.8 routing-mark=to_ISP1 check-gateway=pingadd distance=2 gateway=221.132.112.8 routing-mark=to_ISP2 check-gateway=ping## Create destinations to "virtual" hops to be use in further routesadd dst-address=10.0.0.1 gateway=8.8.8.8 scope=10 target-scope=10 check-gateway=pingadd dst-address=10.0.0.2 gateway=221.132.112.8 scope=10 target-scope=10 check-gateway=ping## Add default routes for both isp's marked packets by mangle sectionadd distance=1 gateway=10.0.0.1 routing-mark=to_ISP1add distance=2 gateway=10.0.0.2 routing-mark=to_ISP2## Add default routes for no routing marks , For router itselfadd distance=1 gateway=10.0.0.1add distance=2 gateway=10.0.0.2 |
http://wiki.mikrotik.com/index.php?title=Advanced_Routing_Failover_without_Scripting
Regard’s
Waseem Anjum Meo


Hot51 Mod APK 1.1.536 Terbaru Unlimited Money - CRFile
ReplyDelete